




For small business owners, the checkout line can feel more like a countdown clock ticking down to a lost sale. That pressure is real: delayed payments and checkout friction cost 45% of SMB owners personally, and nearly one-third of those affected (32%) forfeit their lunch break entirely. Beyond the missed meals, every outage or processing delay chips away at revenue and the little bandwidth owners have left in the day. “Customers get upset when they are in a hurry to get to their next destination. Unfortunately, at times they can take it out on the employees, making the work environment tense,” says one Millennial SMB owner in business 10+ years. It’s a cost that goes well beyond the transaction itself.
To understand the true cost of checkout friction on both sides of the counter, we surveyed 500 U.S. small and medium-sized business owners and 2,034 U.S. consumers. We built a Checkout Patience Index that ranks every state by checkout patience. The index weighs how long shoppers say they’ll wait before abandoning checkout, how often they’ve abandoned a purchase over slow checkout, and how widely they’ve adopted mobile payments. The results reveal a widening gap between businesses that have modernized their payment processing and those still relying on legacy hardware, and just how much patience, revenue, and personal time are on the line at checkout.
Key Takeaways
- Ohio shoppers are the most patient at checkout, while North Carolina shoppers have the shortest fuse.
- While the average American walks away from a slow checkout experience after just 12 minutes, Gen Z proves 52% more patient than older generations, with 47% willing to wait 15 minutes or more.
- Consumers are 44% more likely to abandon a slow checkout when shopping alone than when shopping with others.
- Delayed payments and checkout friction cost 45% of SMB owners personally, and nearly one-third of those affected (32%) forfeit their lunch break.
- Nearly one in five SMB owners have dipped into personal savings to cover equipment or processing costs due to the operational costs of payment processing, averaging $1,091 annually out of pocket.
- Over one in three SMB owners has no backup plan for handling payment disruptions like Wi-Fi issues, slow processing, or power outages.
- Thirty-eight percent of SMB owners say mobile payments help them unlock revenue sooner than traditional processing.
How long will customers wait in line before leaving a store?
Before ranking states, we uncovered what checkout patience looks like nationally, including how long shoppers will really wait and what makes some walk away faster than others.
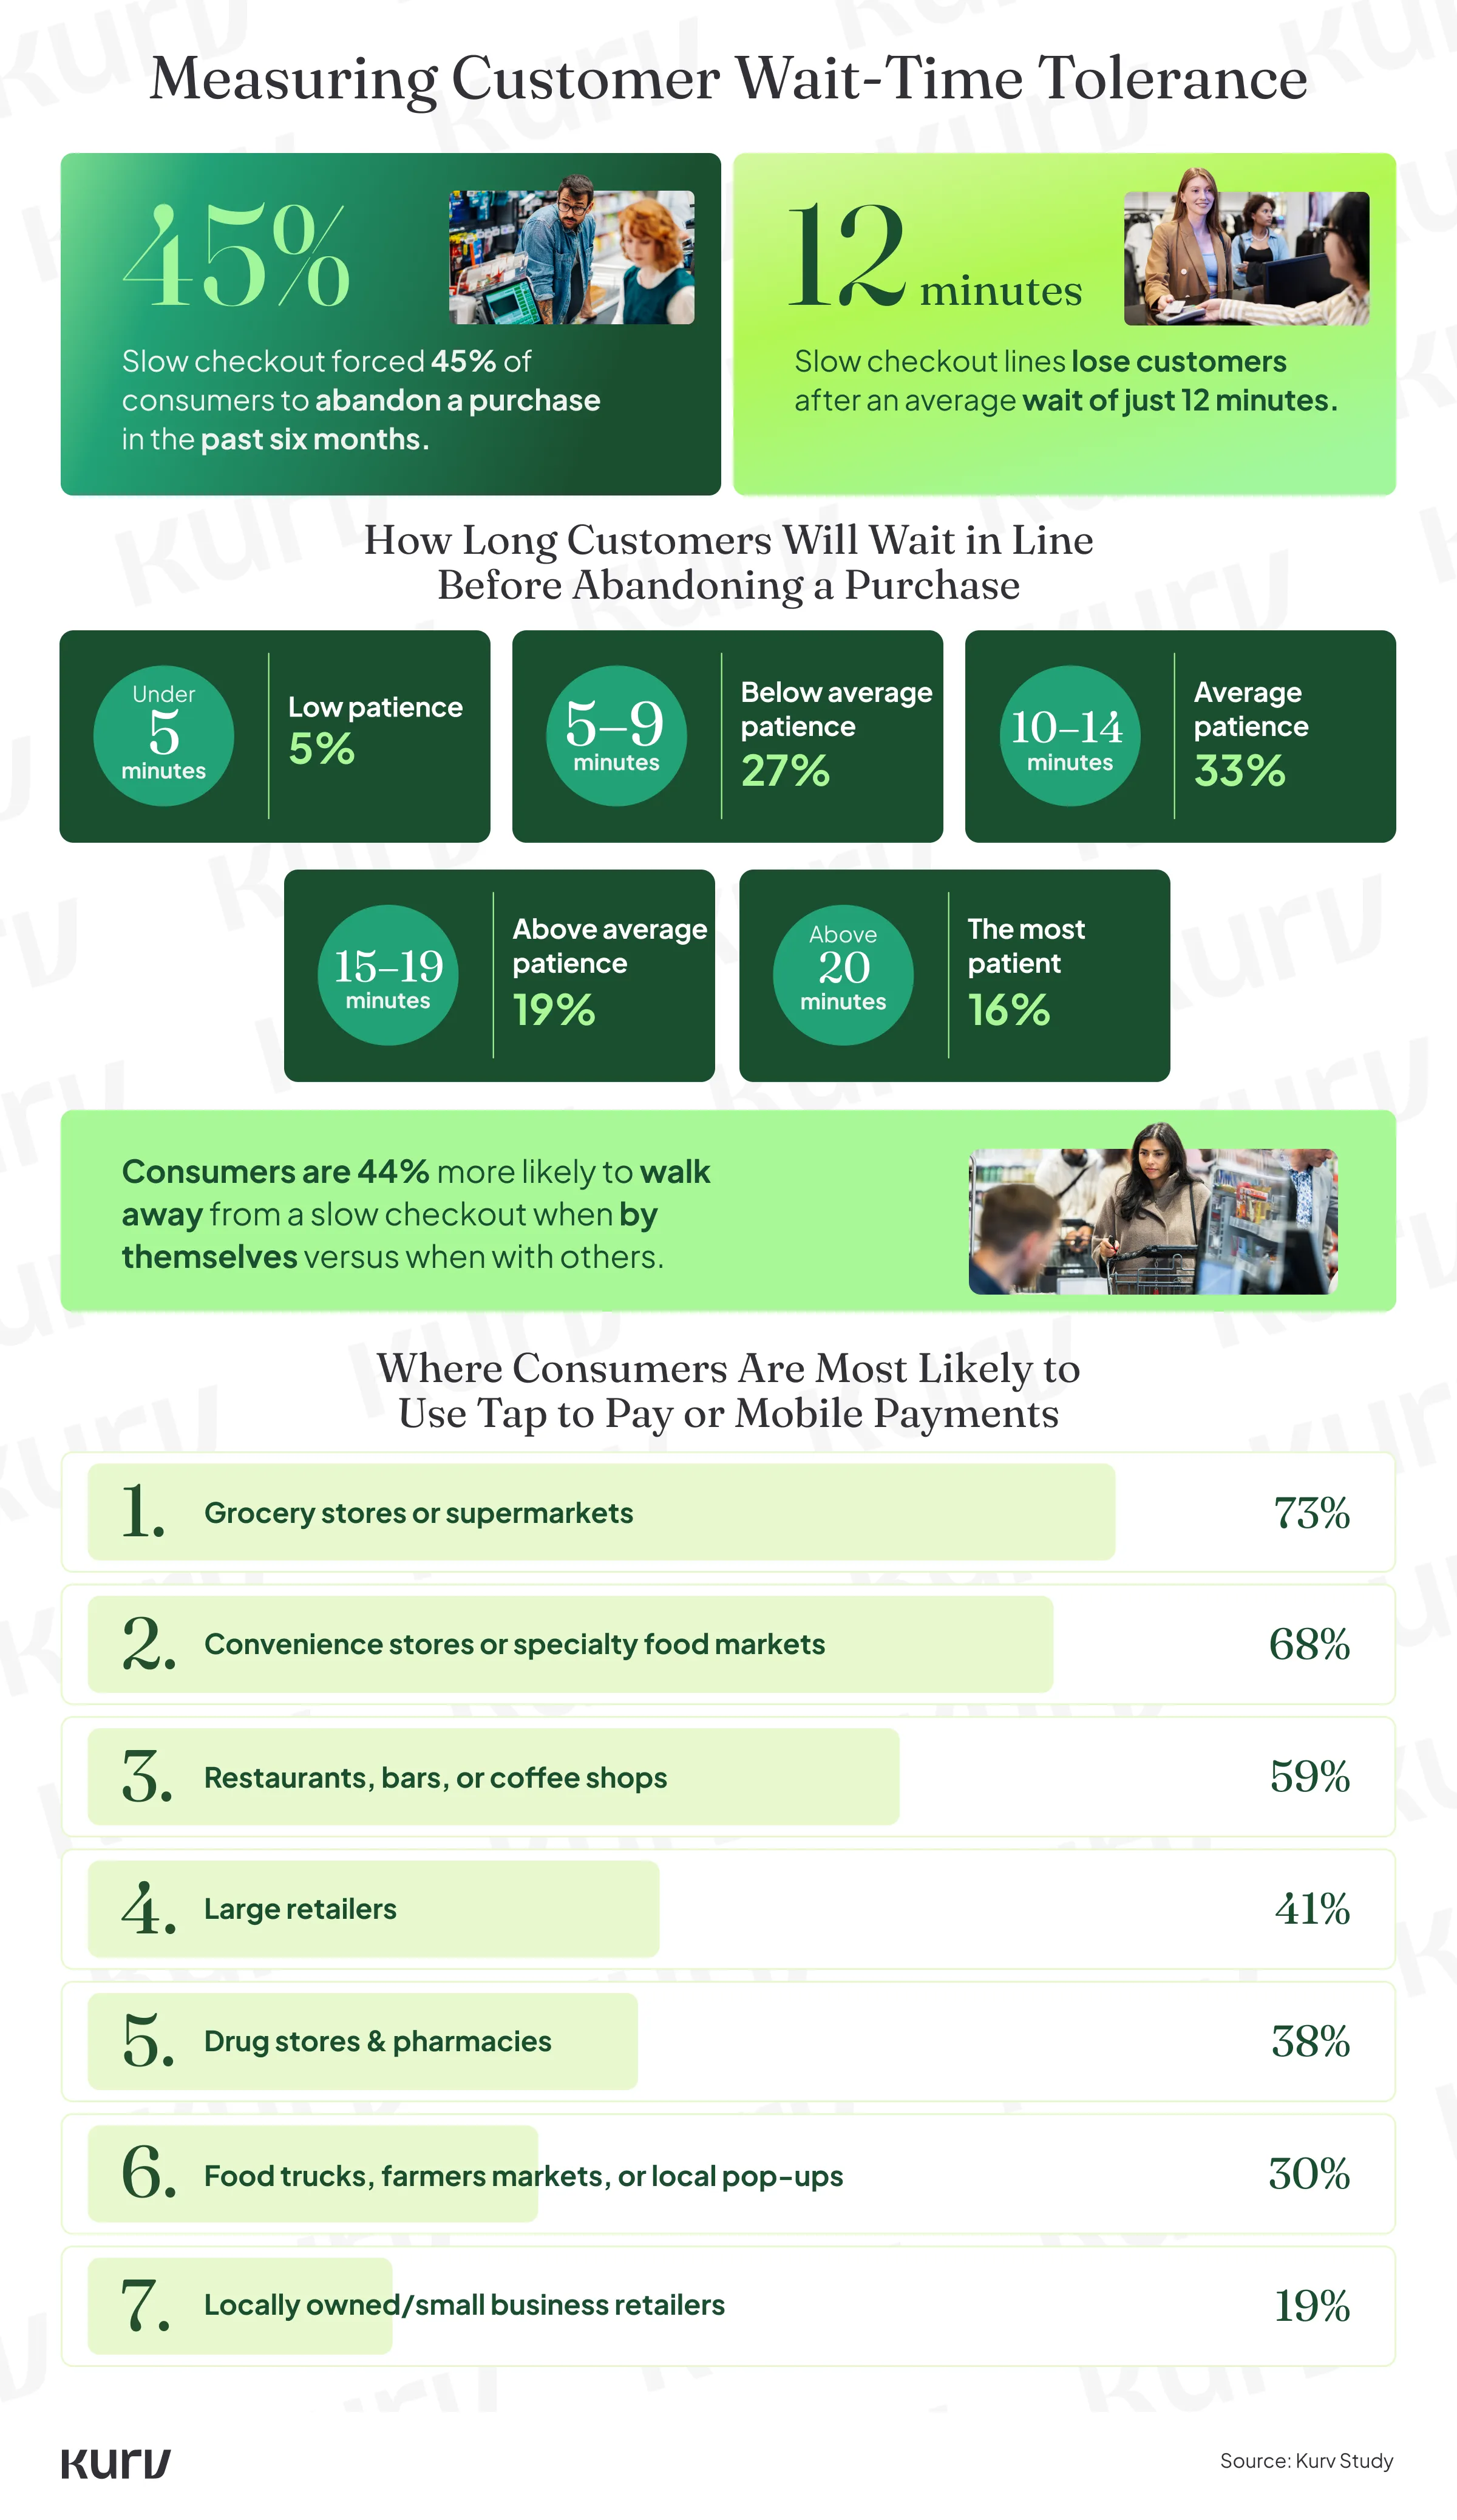
Nationally, shoppers say they’ll wait an average of 12 minutes before walking away from a slow checkout, and 45% say they’ve abandoned at least one purchase due to slow checkout in the past six months. That patience threshold swings widely by state —from nearly 14 minutes in Vermont to just 10 minutes in North Carolina—and the least patient states also tend to have the highest spend exposure, meaning slow checkout is a bigger revenue risk there than almost anywhere else in the country.
How much spending is at risk from slow checkout nationally?
Applying that 45% abandonment rate to BEA’s annual per-capita spending puts the national exposure at an estimated $8,544 per person on goods and $1,970 on food services and accommodations. Two subcategories of goods show the pattern on a smaller scale: clothing and footwear (about $737) and gasoline and other energy goods (about $551). These are directional estimates of annual spending at risk, not measured losses.
How Is Checkout Patience Measured Across States?
Patience at checkout varies more by geography than most business owners realize. Our Checkout Patience Index ranks every state to show where merchants have the most room for error at the register and where a slow line can cost them a customer for good.
To build the Checkout Patience Index, we combined consumer survey data on in-store shopping experiences with Bureau of Economic Analysis data on state-level per-capita consumer spending, which captures both in-person and online spending, to estimate the potential revenue loss when a customer abandons a purchase in each state.
The survey component includes how long shoppers say they’ll wait before abandoning a purchase, how often they’ve walked away from a slow checkout in the past six months, and how widely they’ve adopted mobile payments. Much of that patience gap comes down to how fast the payment itself moves. With contactless tools like tap to pay, transactions can be cut to a few seconds, which is the kind of speed the highest-ranked states are already seeing at checkout.
Top Five States With The Most Patient Shoppers
1. Ohio (Checkout Patient Index: 100/100) — Ohio shoppers are among the least likely to abandon a purchase because of a slow checkout, with 29% reporting that they’ve done so in the past six months, compared with 45% nationwide. They also wait an average of 13.3 minutes and have a 90% mobile-payment adoption rate, giving Ohio the strongest overall results.
2. Indiana (Checkout Patient Index: 95.10/100) — Just 28% of Indiana consumers say they’ve abandoned a purchase because of a slow checkout, among the lowest of all states. They also wait an average of 12.8 minutes before giving up, while 80% use mobile payments. Those results put Indiana just behind Ohio.
3. Vermont (Checkout Patient Index: 93.70/100) — Vermont shoppers have the longest average patience threshold in the study at 13.8 minutes. The state also has the highest mobile-payment adoption rate at 94%, helping it earn the No. 3 spot.
4. Idaho (Checkout Patient Index: 89.22/100) — Idaho consumers wait an average of 12.7 minutes before abandoning a slow checkout, while 35% say they’ve walked away from a purchase for that reason in the past six months. Mobile-payment adoption stands at 84%, giving Idaho strong results across all three measures.
5. New Mexico (Checkout Patient Index: 84.45/100) — New Mexico shoppers have one of the longest patience thresholds in the study, waiting an average of 13.7 minutes. Its 32% checkout-abandonment rate is also well below the 45% national average, although mobile-payment adoption is lower at 68%.
Top Five States With The Least Patient Shoppers
50. North Carolina (Checkout Patient Index: 0.00/100) — North Carolina shoppers are among the most tied to traditional payment methods, with just 5% saying they rarely carry a physical wallet. Their patience runs short, too: they’ll wait just 10 minutes on average before abandoning a line, and 55% say they’ve walked away from a purchase because of a slow checkout in the past six months, compared with 45% nationwide.
49. North Dakota (Checkout Patient Index: 2.94/100) — North Dakota has the highest checkout-abandonment rate in the study, with 68% of consumers saying they’ve walked away from a purchase because of a slow checkout. Shoppers there will wait just 9.9 minutes before abandoning a line. What keeps North Dakota out of last place is that 26% of shoppers reported they rarely carry a physical wallet.
48. Arkansas (Checkout Patient Index: 20.87/100) — Arkansas shoppers wait an average of 10 minutes before abandoning a slow checkout, while 54% say they’ve walked away from a purchase for that reason. Its 81% mobile-payment adoption rate wasn’t enough to offset the weaker results in those measures.
47. California (Checkout Patient Index: 22.27/100) — More than half of California consumers (54%) say they’ve abandoned a purchase because of a slow checkout — well above the 45% national average. The state’s average patience threshold is 11.3 minutes, while mobile-payment adoption is relatively high at 88%.
46. New York (Checkout Patient Index: 24.65/100) — New York has a 52% checkout-abandonment rate, compared with 45% nationwide, and shoppers wait an average of 10.9 minutes before giving up. Mobile payment adoption is higher at 87%, while 15% of consumers do not use a digital wallet.
Full 50-State Checkout Patience Ranking
Here’s how every state ranks on checkout patience, from most tolerant to least:
| State | Rank | Avg. Minutes Willing to Wait Before Line Abandonment | % Using Mobile Payments at Small Businesses | % That Abandoned Checkout in Past Six Months | Est. $ Per Capita Merchants Stand to Lose — Food & Accommodation | Scaled Score |
| Ohio | 1 | 13.3 | 90% | 29% | $1,014 | 100.00 |
| Indiana | 2 | 12.8 | 80% | 28% | $972 | 95.10 |
| Vermont | 3 | 13.8 | 94% | 41% | $1,822 | 93.70 |
| Idaho | 4 | 12.7 | 84% | 35% | $1,122 | 89.22 |
| New Mexico | 5 | 13.7 | 68% | 32% | $1,359 | 84.45 |
| Virginia | 6 | 12.3 | 85% | 38% | $1,643 | 81.79 |
| Massachusetts | 7 | 13.3 | 66% | 37% | $1,876 | 75.77 |
| Michigan | 8 | 13.0 | 77% | 41% | $1,433 | 72.27 |
| Iowa | 9 | 11.4 | 79% | 32% | $1,013 | 71.99 |
| Pennsylvania | 10 | 12.2 | 81% | 41% | $1,491 | 71.85 |
| Montana | 11 | 11.7 | 46% | 21% | $897 | 69.33 |
| Nebraska | 12 | 11.2 | 86% | 29% | $1,044 | 67.37 |
| Delaware | 13 | 12.7 | 62% | 43% | $1,938 | 64.85 |
| Missouri | 14 | 11.2 | 79% | 33% | $1,289 | 64.01 |
| Kansas | 15 | 13.5 | 81% | 51% | $1,796 | 59.66 |
| Arizona | 16 | 11.3 | 84% | 42% | $1,861 | 57.98 |
| Georgia | 17 | 11.2 | 86% | 44% | $1,811 | 55.04 |
| Minnesota | 18 | 11.2 | 89% | 42% | $1,508 | 54.90 |
| Texas | 19 | 11.8 | 85% | 45% | $1,905 | 53.50 |
| Wyoming | 20 | 10.4 | 73% | 33% | $1,387 | 53.08 |
| South Dakota | 21 | 9.5 | 83% | 28% | $1,090 | 52.52 |
| Maine | 22 | 12.8 | 78% | 43% | $2,102 | 51.68 |
| New Hampshire | 23 | 12.0 | 91% | 45% | $2,040 | 51.54 |
| Alabama | 24 | 13.8 | 82% | 59% | $2,056 | 50.98 |
| Mississippi | 25 | 11.9 | 86% | 54% | $1,846 | 50.70 |
| Oklahoma | 26 | 12.2 | 63% | 48% | $1,781 | 48.18 |
| Nevada | 27 | 13.1 | 83% | 56% | $2,445 | 47.76 |
| Maryland | 28 | 12.2 | 83% | 49% | $2,054 | 47.62 |
| Kentucky | 29 | 11.8 | 74% | 49% | $1,695 | 46.92 |
| Colorado | 30 | 11.2 | 74% | 37% | $2,071 | 46.92 |
| Illinois | 31 | 10.7 | 84% | 39% | $1,717 | 46.08 |
| Utah | 32 | 13.0 | 83% | 58% | $2,003 | 44.96 |
| Oregon | 33 | 10.6 | 63% | 33% | $1,426 | 42.86 |
| Washington | 34 | 11.3 | 77% | 45% | $1,971 | 40.20 |
| Wisconsin | 35 | 10.2 | 84% | 45% | $1,628 | 39.08 |
| Alaska | 36 | 9.4 | 64% | 36% | $1,983 | 38.80 |
| Tennessee | 37 | 11.3 | 79% | 49% | $2,048 | 38.80 |
| West Virginia | 38 | 12.3 | 75% | 57% | $1,821 | 37.82 |
| Hawaii | 39 | 11.5 | 85% | 48% | $2,809 | 37.68 |
| Louisiana | 40 | 11.5 | 88% | 52% | $2,110 | 37.39 |
| New Jersey | 41 | 12.3 | 92% | 56% | $2,457 | 37.25 |
| South Carolina | 42 | 11.7 | 81% | 52% | $2,141 | 33.33 |
| Florida | 43 | 11.5 | 76% | 48% | $2,506 | 30.11 |
| Rhode Island | 44 | 11.0 | 86% | 45% | $2,363 | 29.97 |
| Connecticut | 45 | 11.1 | 87% | 49% | $2,136 | 25.21 |
| New York | 46 | 10.9 | 87% | 52% | $2,586 | 24.65 |
| California | 47 | 11.3 | 88% | 54% | $3,042 | 22.27 |
| Arkansas | 48 | 10.0 | 81% | 54% | $1,675 | 20.87 |
| North Dakota | 49 | 9.9 | 79% | 68% | $2,790 | 2.94 |
| North Carolina | 50 | 10.0 | 81% | 55% | $2,184 | 0.00 |
Note: Two additional metrics are factored into each state’s score but aren’t shown in the table above: the percentage of shoppers who rarely carry a physical wallet (survey data) and the estimated per-capita dollars merchants stand to lose on goods (BEA data).
How Does Checkout Patience Vary Regionally?
For local businesses in the least patient states, that impatience adds up to real dollars. North Carolina and North Dakota also rank among the highest in per-capita spend exposure, so SMBs there stand to lose meaningful revenue every time a line moves too slowly.
Business owners feel that impatience in more ways than one. More than half (51%) point to lost revenue as the top consequence of checkout abandonment, followed by damage to customer loyalty (29%) and negative word of mouth (26%). Lost upsell opportunities (17%), staff frustration (10%), and checkout errors (9%) round out the list, underscoring that a slow checkout costs merchants far more than the sale itself.
| Region | Avg Scaled Score | Avg. Minutes Willing to Wait Before Line Abandonment | % Using Mobile Payments at Small Businesses | % That Abandoned Checkout in Past Six Months | Most Patient State | Least Patient State |
| Midwest | 64.42 | 11.71 | 82.8% | 37.7% | Ohio (100.00) | North Dakota (2.94) |
| Northeast | 49.53 | 12.01 | 83.8% | 45.9% | Vermont (93.70) | New York (24.65) |
| West | 46.25 | 11.68 | 78.1% | 44.3% | Idaho (89.22) | California (22.27) |
| South | 43.27 | 11.72 | 80.1% | 49.1% | Virginia (81.79) | North Carolina (0.00) |
How Do Generation and Wallet Habits Shape Checkout Patience?
Age plays just as big a role in checkout patience as geography, and the data points to one generation in particular when it comes to waiting out a slow line.
As mobile payments and digital wallets gain ground with younger shoppers, checkout patience is shifting generationally. Gen Z shoppers, who grew up tapping to pay, are far more tolerant of a slow line than older generations, even as wallet-free habits reshape what businesses need to accept at the register.
Forty-seven percent of Gen Z shoppers say they’ll wait 15 minutes or more before abandoning a slow checkout, which is 52% more patient than older generations combined. Gen Z is also 39% more likely than older generations to use mobile payments at locally owned small businesses, and just over one in 10 consumers overall say they rarely carry a physical wallet anymore.
That adoption gap shows up clearly by venue type. Consumers are most likely to tap to pay at grocery stores (73%) and convenience stores (68%), with restaurants close behind at 59%. Locally owned small-business retailers see the lowest tap to pay usage of any venue type at just 19%, meaning the merchants least equipped to handle wallet-free customers are also the ones seeing the least demand for it, for now.
| Primary Motivators for Consumer Mobile Payment Wallet Adoption | |
| Faster checkout times and moving through lines quickly | 54% |
| Eliminating the hassle of digging through a bag or purse at the counter | 43% |
| Ease of tracking digital receipts and spending history directly on my phone | 24% |
| Enhanced security features (like FaceID, TouchID, or tokenization) | 19% |
| Spontaneity and the ease of making unplanned or impulse purchases | 14% |
| It is simply my default habit / I rarely think about it anymore | 14% |
| I rarely carry a physical wallet | 12% |
That wallet-free shift creates real risk for merchants who fall back on cash-only workarounds during an outage. Nearly one in four business owners (24%) say they switch to cash-only transactions when payment systems go down — a backup plan that risks locking out the growing share of shoppers who don’t carry cash or cards at all.
How Much Does Slow Payment Processing Cost Business Owners?
For business owners, slow payment processing is a customer-facing problem that also comes with a real, and often personal, price tag.
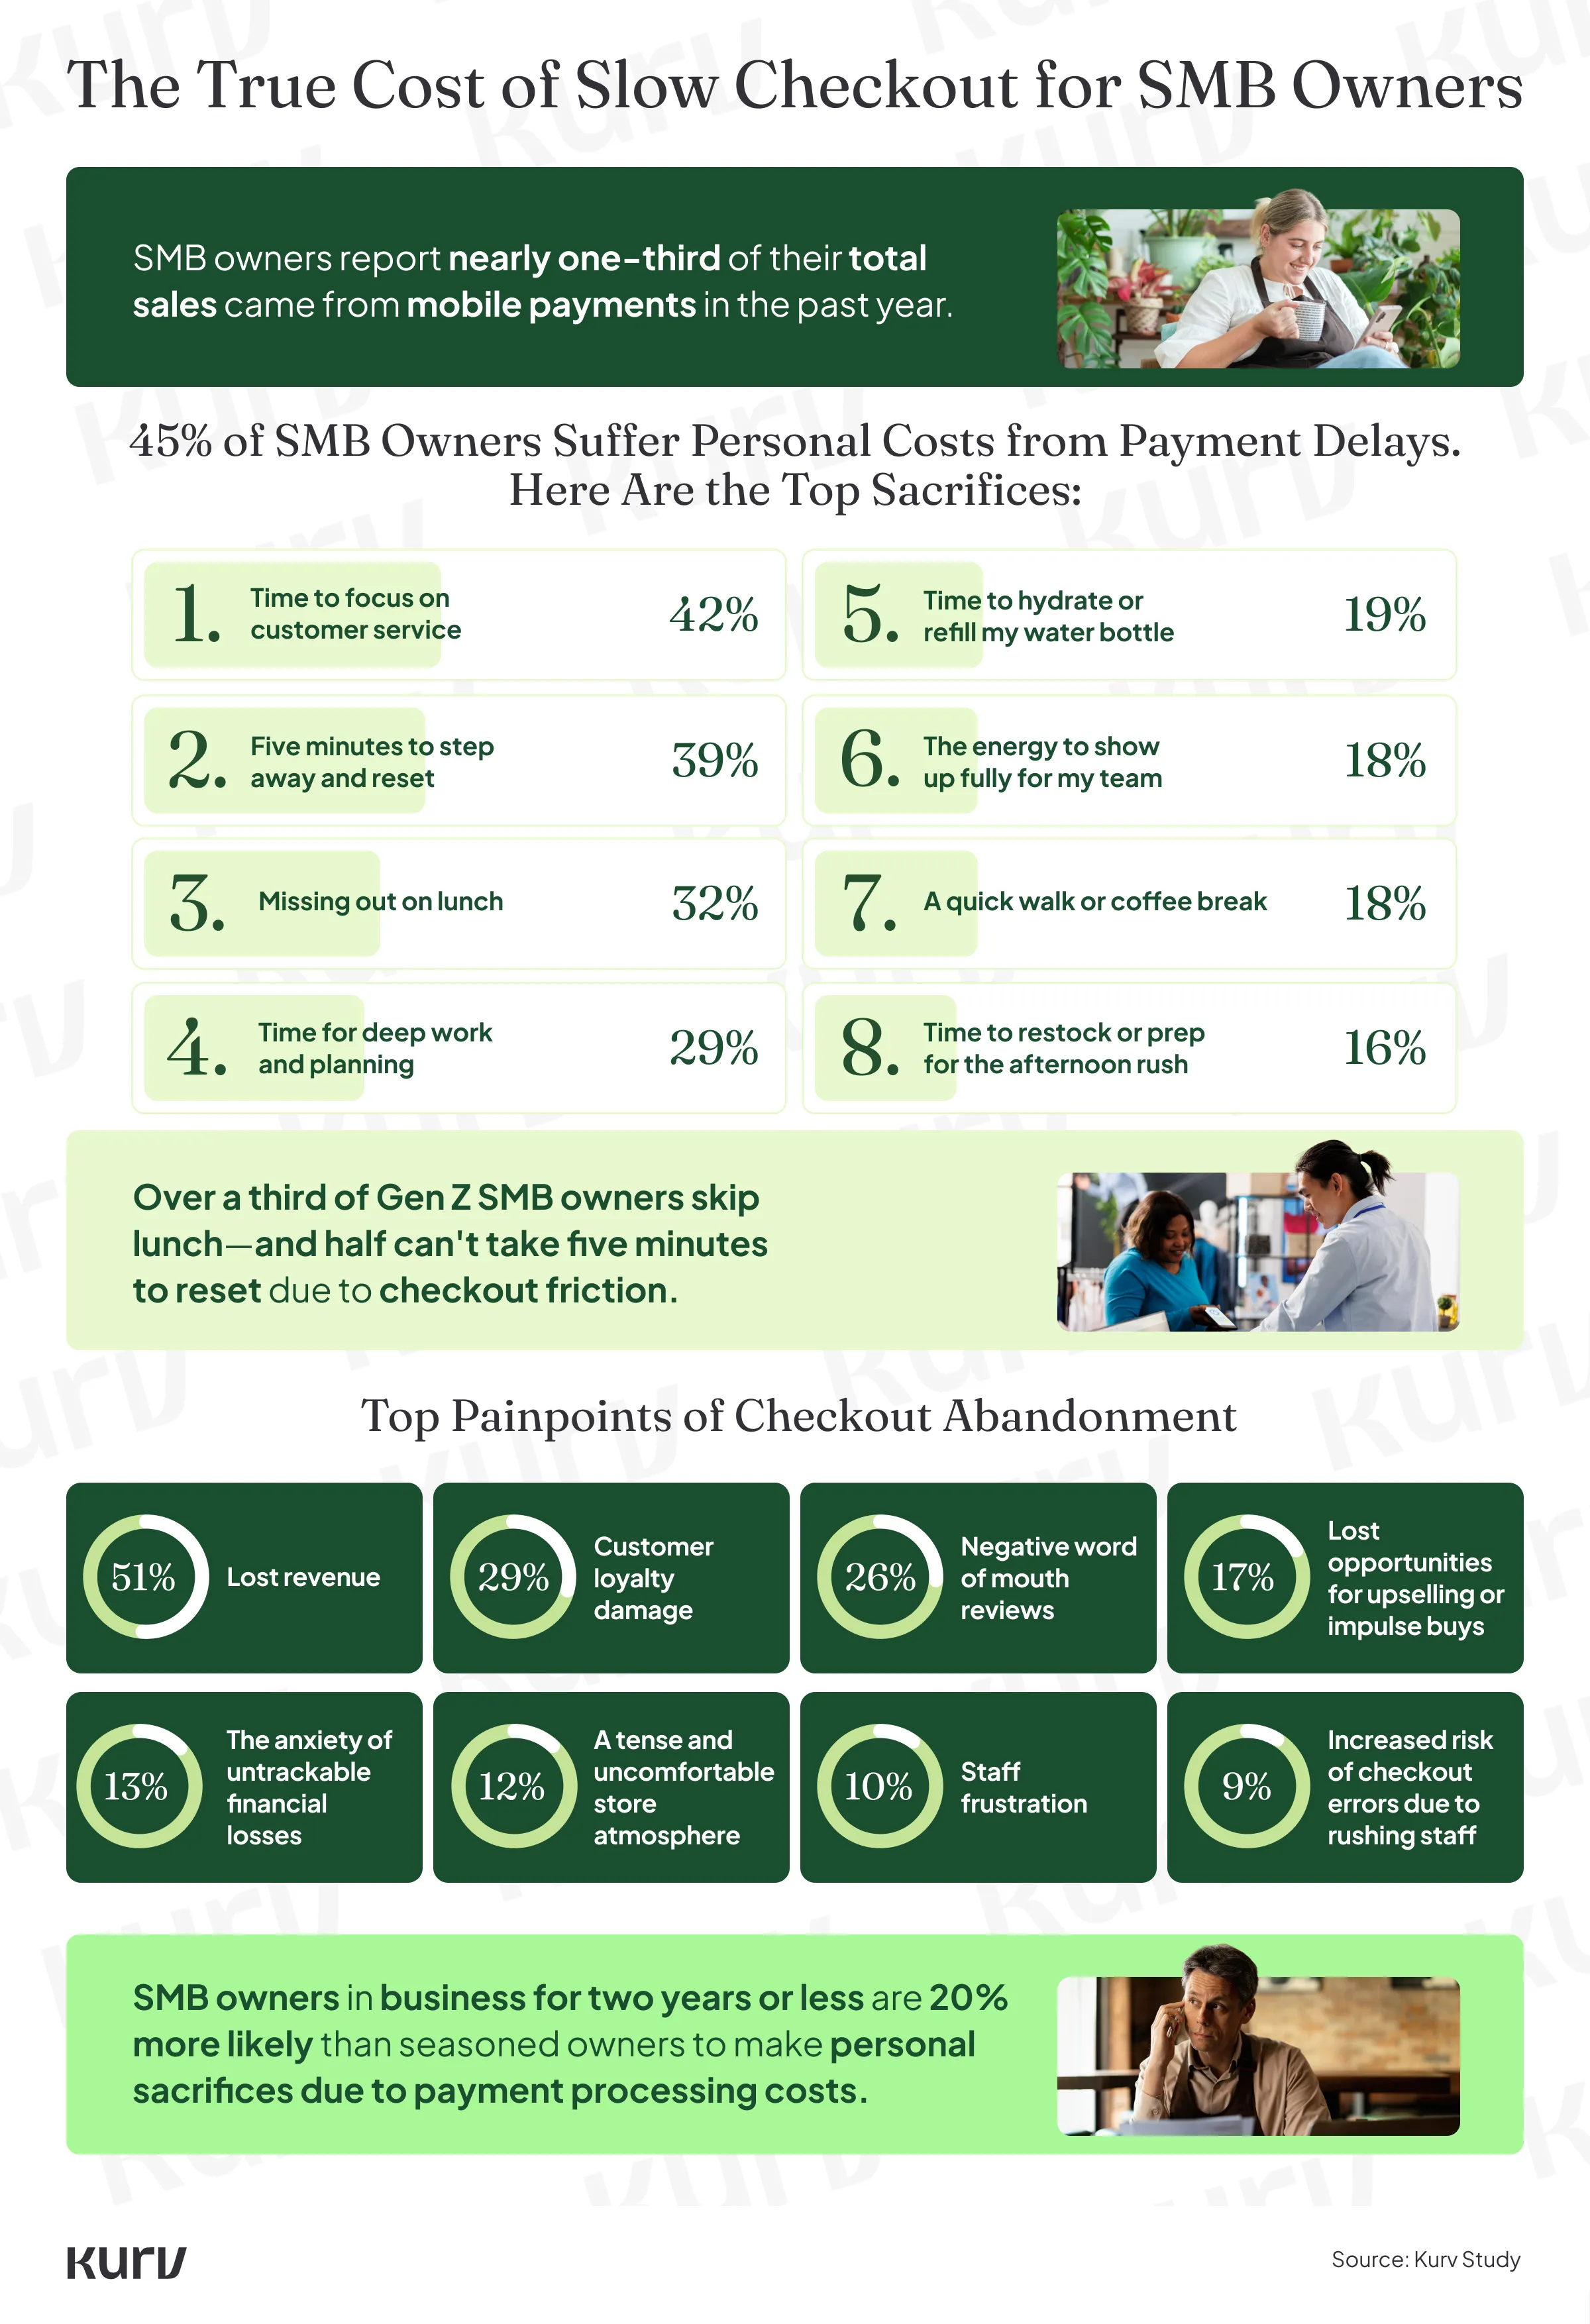
While consumers lose patience in line, business owners absorb the cost behind the counter. From skipped lunch breaks to dipping into personal savings, our research shows outdated payment processing carries a toll that goes beyond a single slow transaction, and it hits younger business owners hardest. The same friction shows up online: slow or clunky payment gateways create the digital equivalent of a long line.
Delayed payments and checkout friction cost 45% of SMB owners personally, and nearly one-third of those affected (32%) forfeit their lunch break entirely. “I had to hold on the phone to speak to the customer service rep for the card reader system I use during lunchtime. I lost time to eat lunch. It was either that or close for the day to fix the problem with the company directly,” says one Millennial SMB owner in business for two years or less.
Gen Z SMB owners are 23% more likely than older business owners to say they’ve made personal sacrifices due to slow payment processing. Over a third (35%) of Gen Z SMB owners skip lunch entirely, and half can’t take even five minutes to reset during the day because of checkout friction.
On the other side, nearly two in five SMB owners (38%) say mobile payments help them unlock revenue sooner than traditional processing, and 29% say avoiding delays from physical terminal delivery has let them start accepting payments and generating revenue from day one. That upside adds up: SMB owners report that mobile payments made up nearly one-third of their total sales over the past year, showing the shift away from legacy processing is already well underway.
Why Are SMBs Shifting to Mobile Payment Acceptance?
| Faster access to funds/improved cash flow | 38% |
| Faster checkout times | 33% |
| Ability to accept payments without waiting for terminal hardware | 29% |
| Lower operational costs (less reliance on cash handling or legacy equipment) | 19% |
| Ability to update items, menus, or pricing in real time to adapt to busy shifts | 12% |
| More mental bandwidth to focus on customers and growing the business | 10% |
| Reliable backup during Wi-Fi or power outages | 6% |
Faster approval timelines mean businesses can start processing payments without dipping into personal savings to cover startup costs, and fewer abandoned sales at checkout leave more revenue available for marketing rather than forcing cuts elsewhere. A phone- or tablet-based point-of-sale system also sidesteps the capital-intensive hardware refresh cycle behind delayed terminal upgrades, and faster access to revenue gives owners more flexibility to restock on schedule instead of pushing it back.
One-third of SMB owners adopted mobile payments specifically to cut wait times and reduce checkout friction. The sacrifices business owners report making because of payment system costs map directly onto the gaps modern payment solutions are built to close:
| Operational Sacrifices Caused by Payment System Costs | Average Annual Dollar Loss |
| Used personal savings to cover equipment or processing costs 18% | $1091 |
| Cut back on marketing or advertising spend 15% | $1121 |
| Delay purchasing or upgrading terminal hardware or technology 12% | $929 |
| Delay restocking or supplies 11% | $1041 |
Marketing cutbacks carry the steepest annual cost at $1,121, followed closely by dipping into personal savings at $1,091. Combined, these figures suggest payment friction isn’t just an inconvenience. It’s actively pulling resources away from the areas owners need most to grow.
How Common Are Payment Processing Outages for Small Businesses?
Nearly one-third of SMB owners faced a payment processing outage in the past year due to a terminal, Wi-Fi, or power failure.
Do small businesses have backup plans for payment outages?
Sixty-three percent say they have a contingency plan in place to keep serving customers. Newer businesses are more exposed: SMBs open two years or less are 23% less likely than more seasoned owners to have a plan to keep serving customers during a disruption.
Twelve percent of consumers say they rarely carry a physical wallet, meaning the 24% of business owners who fall back on cash-only transactions during an outage risk locking out a real slice of their customer base entirely.
That risk is already playing out nationally. According to the Federal Reserve Bank of Atlanta’s Survey and Diary of Consumer Payment Choice, the share of payments made using a mobile phone rose from 28% to 32% of all payments in the most recent data cycle, while the share of consumers who paid with cash in the prior 30 days fell steadily from 87% in 2023 to 83% in 2024, and to 81% in 2025/2026. If that trend holds, a cash-only backup plan covers less of a merchant’s customer base each year than it did the year before.
| How SMB’s maintain service during payment disruptions | |
| Ask customers to pay via a digital peer-to-peer app instead | 32% |
| Switch temporarily to cash-only transactions | 24% |
| Deploy personal mobile hotspots to keep standard terminals online | 23% |
| Offer store credit or “pay later” honor systems to loyal patrons | 13% |
| Manually write down card numbers to process later | 13% |
| Manually calculate taxes and totals using paper and calculator | 11% |
| Direct customers to the nearest physical ATM to get cash | 11% |
Business owners describe the toll of these disruptions in their own words:
“I’ve had to skip meals and miss personal commitments to fix system issues because I’m the primary person who fixes the system issues. Our mobile payment system went out, and I had to update my business to properly use their API.” — Gen Z SMB owner, in business two years or less
What Checkout Friction Really Cost
Checkout friction costs everyone. Consumers lose patience, and business owners lose revenue, time, and often even their lunch break. States like Ohio and generations like Gen Z show what’s possible when mobile payments are the default: shorter lines, more patient customers, and fewer of the everyday sacrifices baked into outdated payment processing.
For business owners, the takeaway is straightforward: outdated payment tech slows transactions while quietly draining revenue, staff time, and personal bandwidth in ways that compound over months and years. The fastest lever most merchants have to pull is also the simplest. Reducing the seconds a customer spends waiting at the register — whether that means adopting mobile payments, adding tap to pay, or moving off legacy terminal hardware that can’t keep pace with modern checkout speeds — protects revenue during the exact moments customers are most likely to walk out the door, and keeps pace with a customer base that’s only getting less patient with time.
Learn about how our transparent payment processing solutions and merchant services can help SMBs identify and implement the right processing model.
Methodology
To explore the true cost of checkout friction on both sides of the transaction, we surveyed 500 U.S. business owners and 2,034 U.S. consumers. The business owner data has a 95% confidence level and a margin of error of approximately 4%; the consumer data has a 95% confidence level and a margin of error of approximately 2%. Because this exploratory research relied on self-reported data, respondents may have biases, and discrepancies may exist between their answers and their actual experiences.
To build the Checkout Patience Index, we combined consumer survey responses with Bureau of Economic Analysis data on state-level per-capita personal consumption expenditures, allowing us to rank states not only by self-reported patience but by the real spending patterns behind it. The dollar estimates multiply BEA’s 2025 annual per-capita spending (in current dollars) by the share of consumers who abandoned a purchase over slow checkout in the past six months, and the national figures apply the same method to U.S. totals.
Fair use statement
We’d love for you to share these findings, but please attribute to Kurv by sharing a link to this page.
Frequently Asked Questions
How does payment processing work?
Payment processing is the behind-the-scenes journey a transaction takes from the moment a customer pays to the moment funds land in a merchant’s bank account. When a customer taps, swipes, or inserts a card (or pays with a digital wallet), the payment gateway passes the request to the card network and the customer’s bank for approval, then routes it back to the merchant in seconds. Understanding how payment processing works and where delays typically happen is the first step to spotting friction before it costs a sale.
How does mobile payment processing work?
Mobile payment processing lets a business accept payments using a smartphone or tablet instead of a traditional countertop terminal, routing each transaction through the same secure payment gateway solutions used by standard card payments. Customers tap their card or phone, or scan a QR code, and the transaction is encrypted and sent through the same secure network as a standard card payment. Because mobile payments don’t depend on dedicated hardware, businesses can start accepting payments as soon as they’re approved, without waiting on a terminal shipment.
What happens when I use my card for tap to pay?
When a customer holds their card, phone, or smartwatch near a reader for tap to pay, the device uses near-field communication (NFC) to send encrypted payment data to the reader, so no swiping, inserting, or signature is required. The reader passes that request to the payment processor for authorization, and the terminal confirms approval almost instantly.
How fast do mobile tap to pay payments process?
Most tap to pay transactions are authorized in just a few seconds, and they’re often faster than a traditional chip transaction, since there’s no card insertion or waiting for a chip to be read. That speed is exactly what’s driving the shift: Our research found that faster checkout times are the top reason SMB owners adopt mobile payments in the first place.
How much does slow checkout cost small businesses?
Slow checkout carries a real personal cost for business owners. Roughly one in five SMB owners have dipped into personal savings to cover equipment or processing costs, averaging $1,091 out of pocket annually. Owners also report cutting back an average of $1,121 from marketing and advertising spend, delaying $929 in terminal hardware or technology upgrades, and pushing back $1,041 in restocking or supply purchases, all tied to the operational strain of outdated payment processing.
Which U.S. state has the most patient checkout shoppers?
Ohio. Shoppers there are among the least likely to abandon a purchase over a slow checkout, with just 29% doing so in the past six months compared with 45% nationwide, and they wait an average of 13.26 minutes before giving up.
Why do small business owners skip lunch because of payment processing?
Payment and checkout friction, including outages, slow terminals, and processing delays, regularly forces 45% of business owners to make sacrifices. Among owners personally affected by delayed payments, nearly a third (32%) regularly give up their lunch.
Do customers wait longer when shopping alone versus with others?
No, actually, the opposite is true. Consumers are 44% more likely to abandon a slow checkout when shopping alone than when shopping with others, meaning solo shoppers are your least patient customers at the register.

